
- Bitcoin price failed to recover above $11,100 and recently declined against the US Dollar.
- The price is currently under pressure and it recently broke the $10,000 support level.
- There is a major bearish trend line forming with resistance near $10,080 on the 4-hours chart of the BTC/USD pair (data feed from Coinbase).
- The pair is likely to accelerate losses and it might soon revisit the $9,100 and $9,000 support levels.
Bitcoin price is facing an increase in selling pressure below $10,000 against the US Dollar. BTC could accelerate losses and it might even break the $9,000 support in the near term.
Bitcoin Price Analysis
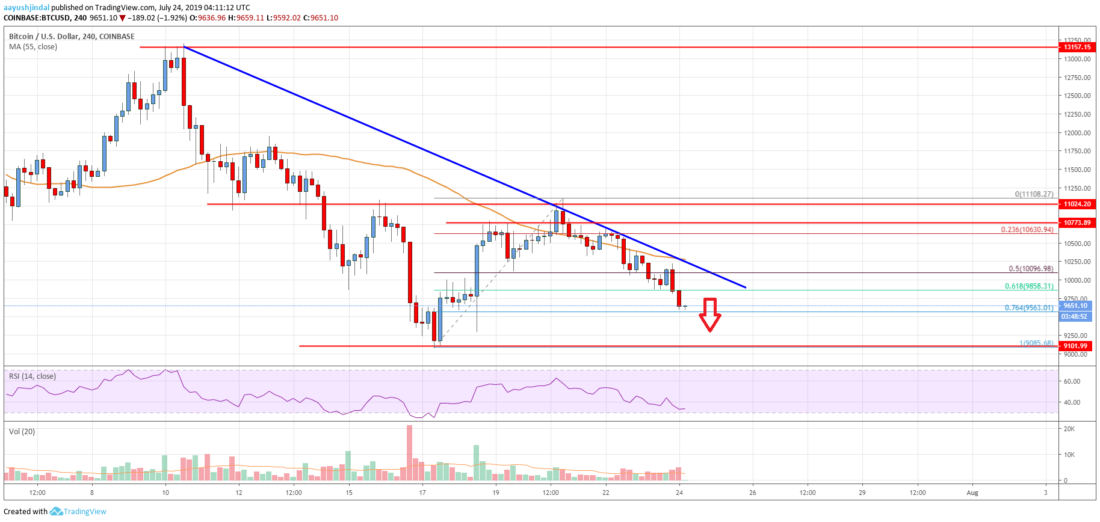
This week, bitcoin price failed to gain momentum above the $10,800 and $11,000 resistances against the US Dollar. The BTC/USD pair topped near the $11,108 level and recently started a fresh decline. The pair broke many important supports, including $10,500 and $10,200. As a result, the price moved into a bearish zone below $10,000 and the 55 simple moving average (4-hours).
The price even broke the 61.8% Fib retracement level of the upward move from the $9,085 low to $11,108 high. The current price action is bearish below $10,000, suggesting more losses in the near term. An immediate support is near the $9,550 level. The 76.4% Fib retracement level of the upward move from the $9,085 low to $11,108 high might also act as a support.
If there are more losses below the $9,550 and $9,500 levels, the price is likely to revisit the $9,085 swing low. In the mentioned case, the price could even break the $9,000 support level. The next key support could be near the $8,600 level. It represents the 1.236 Fib extension level of the upward move from the $9,085 low to $11,108 high. On the upside, there are a key resistances forming near $10,000.
Moreover, there is a major bearish trend line forming with resistance near $10,080 on the 4-hours chart of the BTC/USD pair. To start a decent recovery, the pair needs to climb above the trend line and $10,100. The main resistance is near the $10,350 level and the 55 simple moving average (4-hours).
Looking at the chart, bitcoin price is clearly under a lot of pressure below $10,000. Therefore, there is a risk of more downsides below the $9,500 support. If the bears remain in action, the price could even break the $9,000 support level in the coming days.
Technical indicators
4 hour MACD - The MACD is gaining momentum in the bearish zone.
4 hour RSI (Relative Strength Index) - The RSI is currently well below the 40 level, with a bearish angle.
Key Support Levels - $9,500 and $9,000.
Key Resistance Levels - $10,100, $10,350 and $10,500.
The post Bitcoin Price Analysis: BTC Poised To Break The $9K Support appeared first on Live Bitcoin News.

Cryptocurrency is a digital currency that uses encryption (cryptography) to regulate the generation of currency and verify the transfer of funds, independently of a central bank. Cryptography is the practice and study of techniques for secure communication in the presence of third party adversaries.
Blockchain 101 · Crytpo Currency Market
---------------------------------------------------
Trezor: Hardware Wallet
Binance: Exchange for Traders
Ledger Nano S: Hardware Wallet
Coinbase: Exchange for Investors
CoinSwitch: Wallet-to-Wallet Exchange