
Bitcoin Price Analysis (BTC/USD)
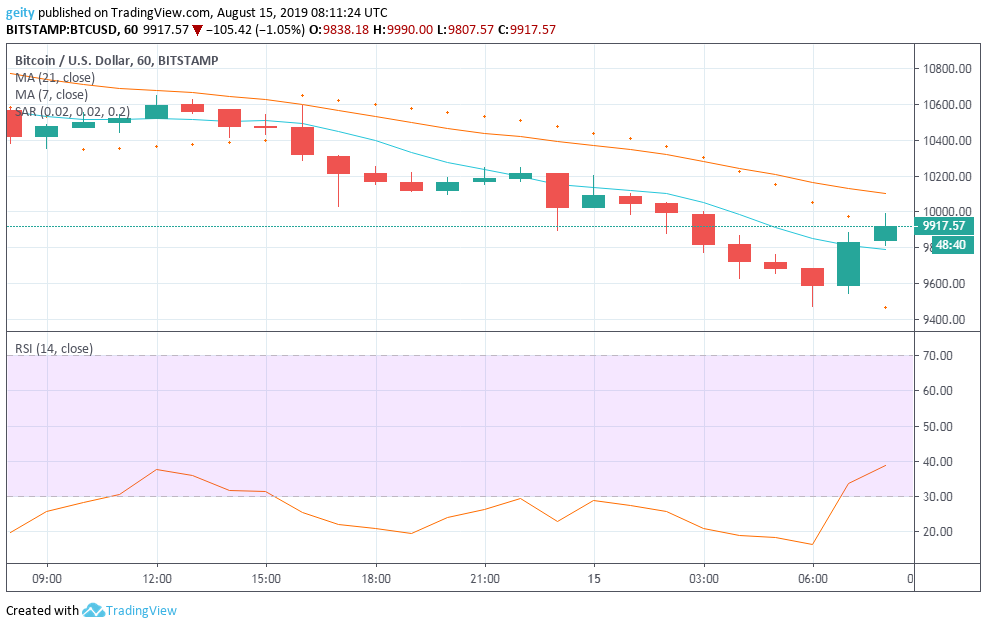
On an intraday chart, the price of BTC/USD pair has further dipped from the previous price of 10473.00 and is currently changing hands at $9917.57 that translated to an intraday dip of 5.3%. The bulls seemed to have lacked the means or strategy to pull up the market momentum. This was reflected by the 21 day MA that hovered above the 7 day MA over the last 24hrs.
The RSI was also seen trading below the oversold territory that signaled a buy sign. This also confirmed sellers have the upper hand. At around 06:00 traders brought the momentum back up as reflected by the RSI indicator that is currently heading north indicating an increase in buyouts.
Bitcoin Price Prediction (BTC/USD)
Currently, most indicators signal price recovery shortly. The parabolic indicator is presently below the pair’s price that indicates a buy signal. The RSI indicator has also gained momentum and is tending Northway that signal a bullish outlook. New target should be set at $10400.0
Bitcoin Cash Price Analysis (BCH/USD)
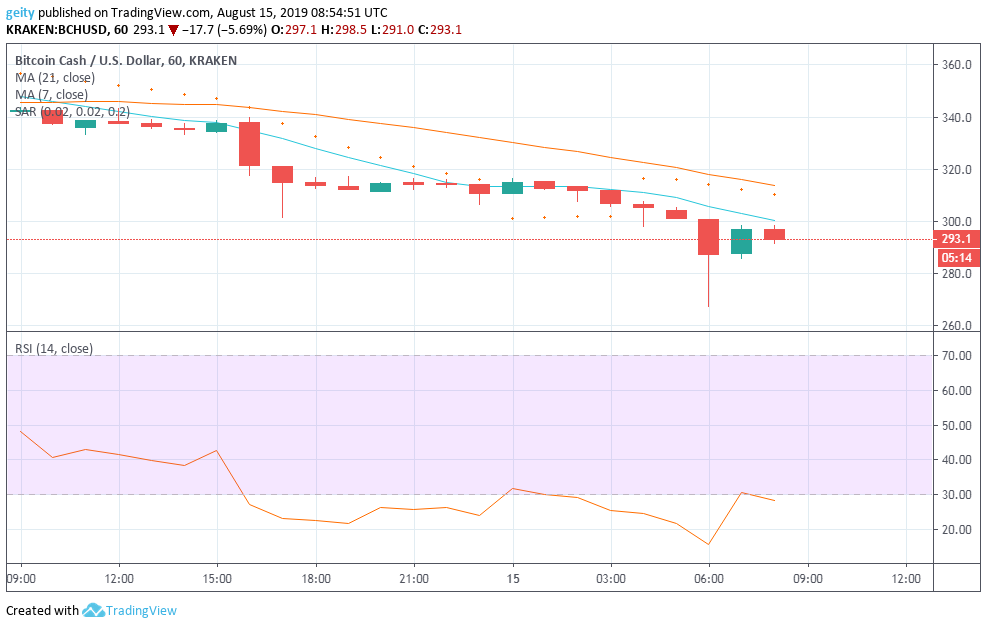
BCH/USD has also exhibited a bearish momentum over the last 24hrs. BCH has down surged by 14.4% where it sharply faced a price fall from yesterday’s price of $342.6 to currently changing hands at $293.1. The downward move has been bolstered by the 21 day MA that gravitated above the 7 day MA throughout the intraday, which also signaled an increase in sell-offs.
The RSI indicator was also seen below the oversold territory that gives traders a negative sign. The downwards pressure has led to $5.581 billion by market capitalization with a circulating supply of 17.95 million coins.
Bitcoin Cash Price Prediction (BCH/USD)
A further downtrend is likely since the parabolic SAR is currently above the price and the price is above the moving averages. Conversely, if the price breaches the moving averages, it can shift up to 340.00 level.
Binance Coin Price Analysis (BNB/USD)
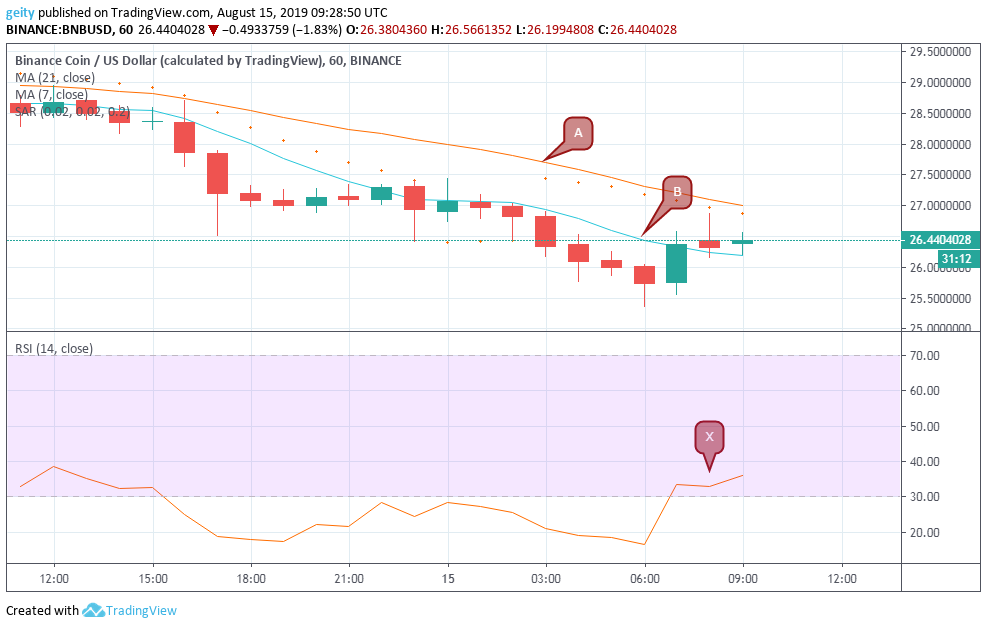
BNB/USD pair has also lost by 7.2% in the last 24hrs; the pair’s price started the sell-off trading at $28.5126 and is now trading at $26.4404. The bears seemed to have the upper hand since both moving averages are sloping downwards.
However, the traders seemed to remain on the sidelines since they are waiting for a reliable sell setup to form. The RSI indicator that is currently heading north confirmed this. An upsurge above $27.4103 is likely to be seen.
Binance Coin Price Prediction (BNB/USD)
At the moment, all the indicators point at a more bearish outlook since the 21 day MA is still above the 7 day MA. Parabolic SAR is also above the candles that is a sell sign. However, if the price breaks above the 21 day MA, traders should go long and take profit at $28.0000.
Cryptocurrency Charts By Tradingview
Disclaimer: This is not trading or investment advice. The above article is for entertainment and education purposes only. Please do your own research before purchasing or investing into any cryptocurrency or digital currency.
The post Bitcoin, Bitcoin Cash, and Binance Coin Price Prediction and Analysis for August 17th: BTC, BCH, and BNB appeared first on NullTX.

Cryptocurrency is a digital currency that uses encryption (cryptography) to regulate the generation of currency and verify the transfer of funds, independently of a central bank. Cryptography is the practice and study of techniques for secure communication in the presence of third party adversaries.
Blockchain 101 · Crytpo Currency Market
---------------------------------------------------
Trezor: Hardware Wallet
Binance: Exchange for Traders
Ledger Nano S: Hardware Wallet
Coinbase: Exchange for Investors
CoinSwitch: Wallet-to-Wallet Exchange