
- Bitcoin cash price broke the key $290 support level to move into a downtrend against the US Dollar.
- The price is currently trading in a bearish zone and it might struggle to correct above $290 and $300.
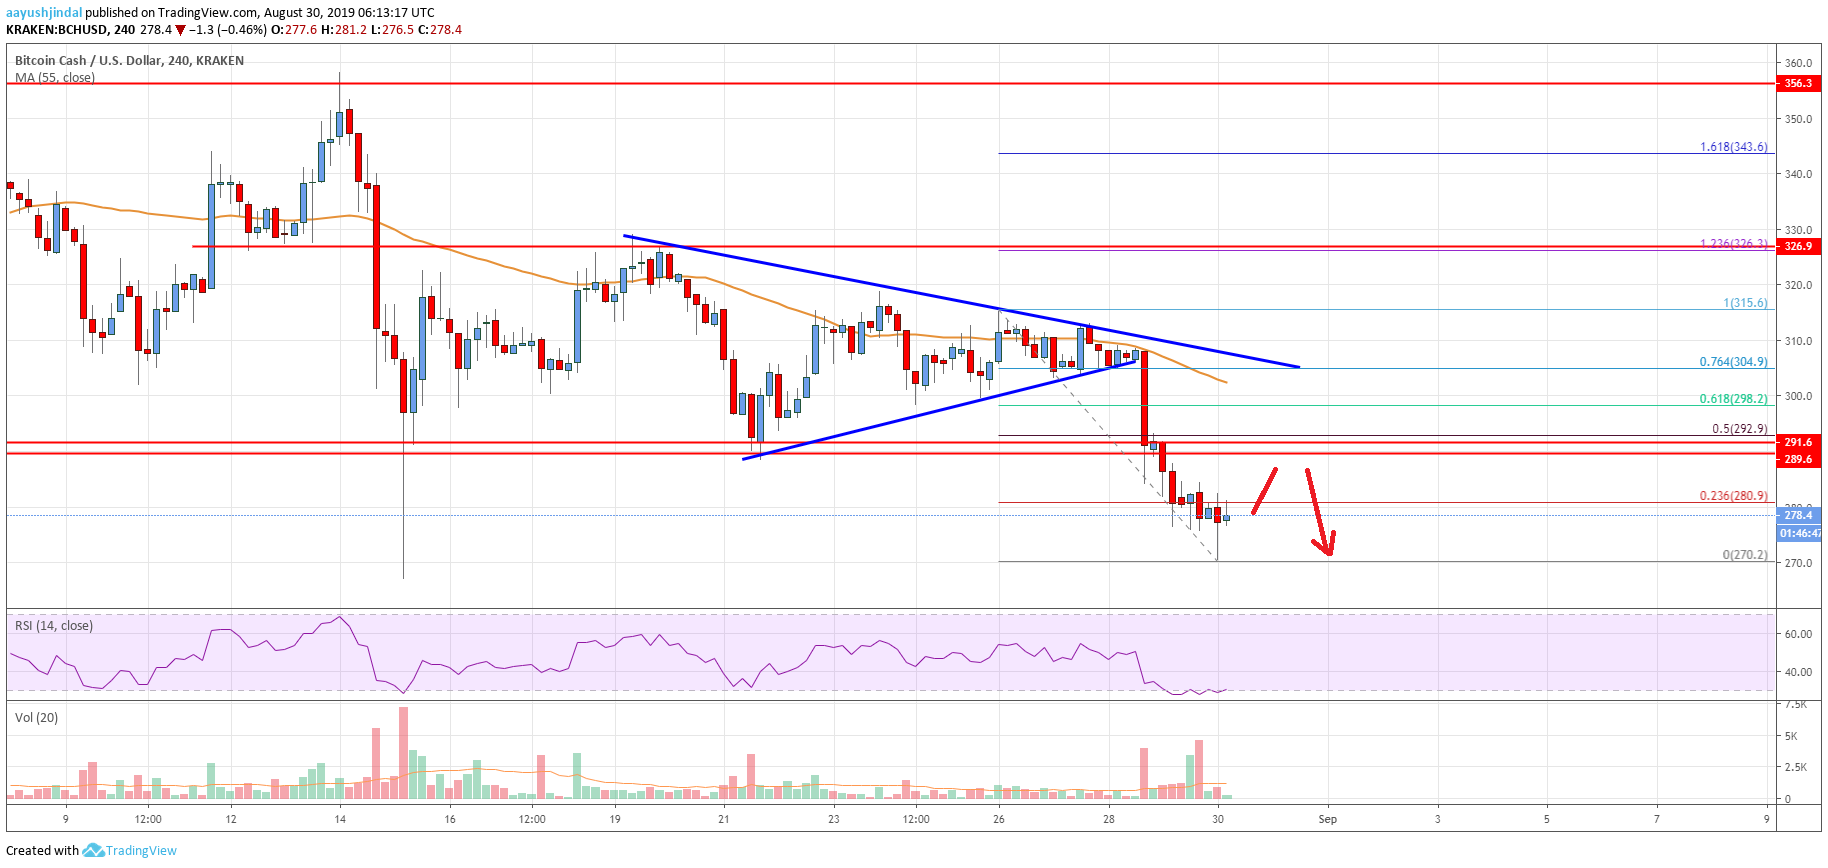
- There is a key bearish trend line forming with resistance near $304 on the 4-hours chart of the BCH/USD pair (data feed from Kraken).
- The pair could extend its decline towards the $250 support if it breaks the $270 support.
Bitcoin cash price is now trading in a bearish zone below $290 against the US Dollar. An upside correction in BCH is likely to face sellers near $290 and $295.
Bitcoin Cash Price Analysis
In the past few days, bitcoin cash price struggled to break the $315 and $320 resistances against the US Dollar. As a result, the BCH/USD pair started a fresh decline and broke the $300 support level. Moreover, it broke the main $290 support level and settled below the 55 simple moving average (4-hours). It opened the door for more downsides and the price traded as low as $270.
The price is currently consolidating losses above $270. An immediate resistance is near the $280 level. Moreover, the 23.6% Fib retracement level of the recent slide from the $315 high to $270 low is also near $280. However, the main resistance on the upside is near the $290 level (the previous support area). Additionally, the 50% Fib retracement level of the recent slide from the $315 high to $270 low is also near the $292 level to stop gains.
More importantly, there is a key bearish trend line forming with resistance near $304 on the 4-hours chart of the BCH/USD pair. Therefore, the price is likely to struggle near the $290 and $292 resistance levels. Only a close above the $300 level and the 55 simple moving average (4-hours) might open the doors for a decent upward move.
An immediate support is near the $270 level. If there is a downside break below the $270 support, the price could decline heavily towards the $250 support in the near term. An intermediate support is near the $262 level.
Looking at the chart, bitcoin cash price is clearly trading in a downtrend below $300 and $290. If there is an upside correction, the previous supports near $290, $292 and $300 are likely to act as barriers. On the downside, the $250 support holds the key for more losses.
Technical indicators
4 hours MACD - The MACD for BCH/USD is losing momentum in the bearish zone.
4 hours RSI (Relative Strength Index) - The RSI for BCH/USD is currently recovering above the 30 level.
Key Support Levels - $270 and $250.
Key Resistance Levels - $290 and $300.
The post Bitcoin Cash Analysis: BCH Turned Sell On Rallies appeared first on Live Bitcoin News.

Cryptocurrency is a digital currency that uses encryption (cryptography) to regulate the generation of currency and verify the transfer of funds, independently of a central bank. Cryptography is the practice and study of techniques for secure communication in the presence of third party adversaries.
Blockchain 101 · Crytpo Currency Market
---------------------------------------------------
Trezor: Hardware Wallet
Binance: Exchange for Traders
Ledger Nano S: Hardware Wallet
Coinbase: Exchange for Investors
CoinSwitch: Wallet-to-Wallet Exchange