
- Bitcoin cash price declined heavily and broke the key $285 and $270 support levels against the US Dollar.
- The price tested the $200 support area and it is currently consolidating losses.
- There was a break below a crucial bullish trend line with support near $310 on the 4-hours chart of the BCH/USD pair (data feed from Kraken).
- The pair could correct higher, but the $230 and $240 levels are likely to prevent gains.
Bitcoin cash price is trading in a larger downtrend below $250 against the US Dollar. If BCH/USD breaks the $200 support, it could continue to slide towards $150.
Bitcoin Cash Price Analysis
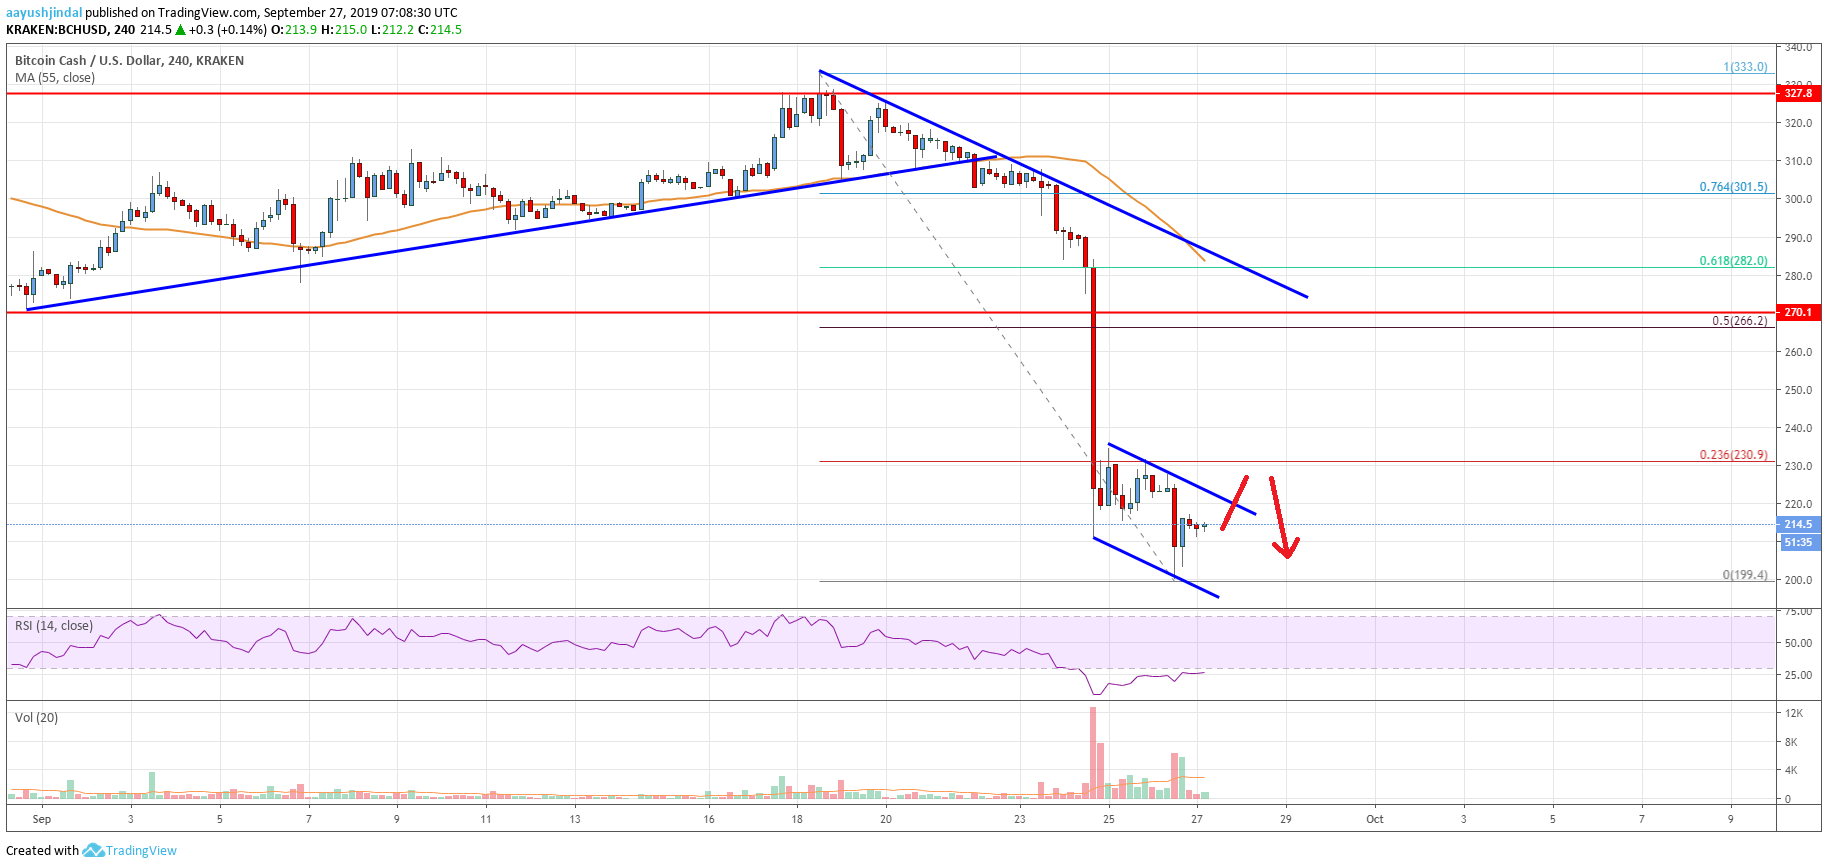
In the past three days, bitcoin cash price declined heavily from well above the $300 level against the US Dollar. The BCH/USD pair topped just above the $330 level before starting a sharp decline. It broke the key $310 and $300 support levels to enter a bearish zone. Moreover, there was a break below a crucial bullish trend line with support near $310 on the 4-hours chart of the BCH/USD pair.
The pair tumbled below the $285 and $270 support levels. Moreover, there was a close below the $250 level and the 55 simple moving average (4-hours). Finally, the price tested the $200 support area and a low was formed near $199. At the moment, the price is correcting higher and is trading above the $210 level. An immediate resistance is near the $220 level and a declining channel on the same chart.
Moreover, the 23.6% Fib retracement level of the recent slide from the $333 high to $199 low is near $230 to stop the upward move. If there is an upside break above $230, the price could recover towards the $240 or $250 resistance. The next key resistance is near the $265 and $270 levels. Additionally, the 50% Fib retracement level of the recent slide from the $333 high to $199 low is at $266.
Therefore, the price is likely to face many hurdles if it breaks the $230 resistance. On the downside, an initial support is near $210. The main support is near the $200 level, below which there is a risk of more downsides towards the $180 level.
Looking at the chart, bitcoin cash price is clearly trading in a bearish zone below $250 and $230. In the short term, there could be an upside correction, but the larger trend is down towards $200 and $180.
Technical indicators
4 hours MACD - The MACD for BCH/USD is losing momentum in the bearish zone.
4 hours RSI (Relative Strength Index) - The RSI for BCH/USD is correcting higher towards the 40 level.
Key Support Levels - $210 and $200.
Key Resistance Levels - $230 and $250.
The post Bitcoin Cash Analysis: BCH Crashes To $200, Likely To Decline Further appeared first on Live Bitcoin News.

Cryptocurrency is a digital currency that uses encryption (cryptography) to regulate the generation of currency and verify the transfer of funds, independently of a central bank. Cryptography is the practice and study of techniques for secure communication in the presence of third party adversaries.
Blockchain 101 · Crytpo Currency Market
---------------------------------------------------
Trezor: Hardware Wallet
Binance: Exchange for Traders
Ledger Nano S: Hardware Wallet
Coinbase: Exchange for Investors
CoinSwitch: Wallet-to-Wallet Exchange