
- Bitcoin price is down roughly 10% and it broke the key $9,000 support against the US Dollar.
- The price is currently consolidating losses below $9,000 and it could continue to slide.
- There was a break below a crucial breakout pattern with support near $10,140 on the 4-hours chart of the BTC/USD pair (data feed from Coinbase).
- The pair is likely to break the $8,150 and $8,000 support levels to extend its decline in the near term.
Bitcoin price is back in a downtrend below $9,000 against the US Dollar. BTC is likely to face a strong resistance near $9,000 and $9,350 if it attempts to recover.
Bitcoin Price Analysis
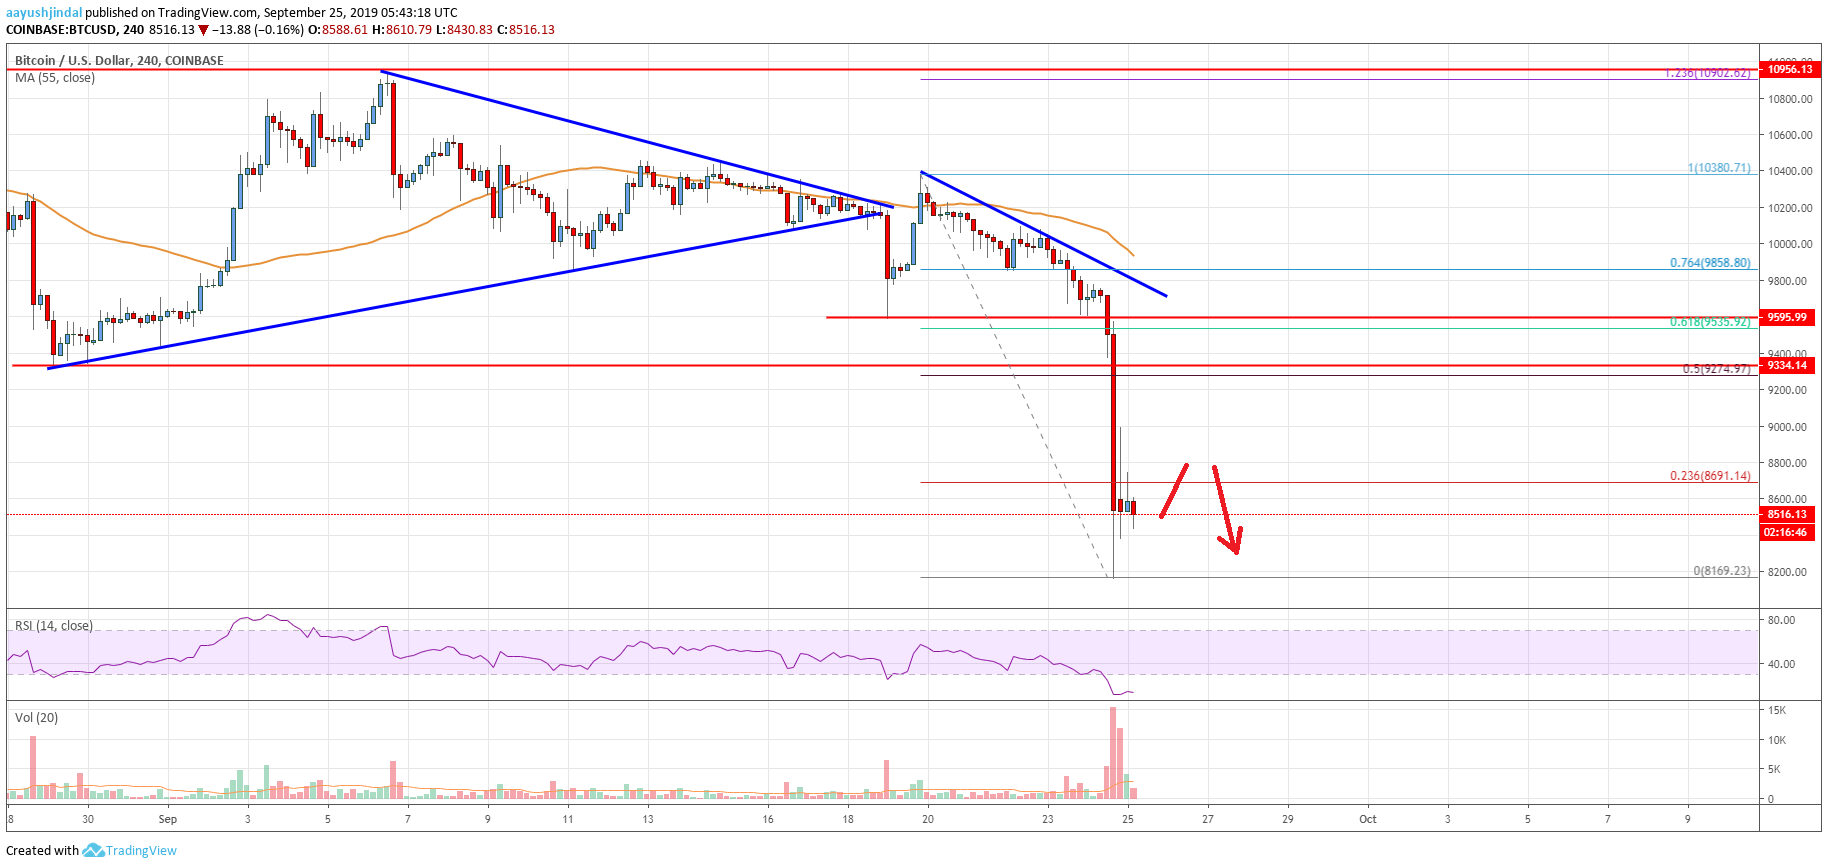
This past week, bitcoin price struggled to rise above the $10,300 resistance against the US Dollar. As a result, the BTC/USD pair started a solid decline below the $10,000 support. Furthermore, there was a close below the $10,000 support and the 55 simple moving average (4-hours). More importantly, there was a break below a crucial breakout pattern with support near $10,140 on the 4-hours chart.
It opened the doors for more downsides below $9,800. This week, the price resumed its decline after a minor upside correction to $10,380. It broke many supports near $9,600 and $9,350 to enter a bearish zone. Moreover, there was a break below the $9,000 and $8,500 supports. A new monthly low was formed near $8,169 and the price is currently consolidating losses.
It tested the 23.6% Fib retracement level of the last major decline from the $10,380 high to $8,169 low. On the upside, there are many hurdles near the $8,800 and $9,000 levels. The main resistance is near the $9,300 level. It coincides with the 50% Fib retracement level of the last major decline from the $10,380 high to $8,169 low. Moreover, there is a connecting bearish trend line forming with resistance near $9,750 on the same chart.
Therefore, an upward move towards the $9,000 and $9,300 levels is likely to face a strong selling interest. The current price action suggests more downsides below the $8,500 level. It seems like the price may even break the $8,169 low and the $8,000 handle in the coming sessions.
Looking at the chart, bitcoin price is now trading in a downtrend below $9,000. In the short term, there could be upsides and recovery, but the bulls are likely to struggle near $9,000 and $9,350. Only a daily close above $9,350 might decrease the current selling pressure.
Technical indicators
4 hour MACD - The MACD is gaining momentum in the bearish zone.
4 hour RSI (Relative Strength Index) - The RSI is currently in the oversold area.
Key Support Levels - $8,160 and $8,000.
Key Resistance Levels - $8,800, $9,000 and $9,350.
The post Bitcoin Price Analysis: BTC Tumbles Below $9K To Enter Downtrend appeared first on Live Bitcoin News.

Cryptocurrency is a digital currency that uses encryption (cryptography) to regulate the generation of currency and verify the transfer of funds, independently of a central bank. Cryptography is the practice and study of techniques for secure communication in the presence of third party adversaries.
Blockchain 101 · Crytpo Currency Market
---------------------------------------------------
Trezor: Hardware Wallet
Binance: Exchange for Traders
Ledger Nano S: Hardware Wallet
Coinbase: Exchange for Investors
CoinSwitch: Wallet-to-Wallet Exchange