
- Bitcoin cash price is currently correcting higher after testing the 200 support against the US Dollar.
- The price is facing a lot of hurdles on the upside near $240 and $250.
- There is a key bearish trend line forming with resistance near $240 on the 4-hours chart of the BCH/USD pair (data feed from Kraken).
- The pair could test the $240 and $250 resistance before it resumes its decline in the near term.
Bitcoin cash price is trading in a bearish zone below $250 against the US Dollar. If BCH/USD continues to struggle below $250, it could even slide below $200.
Bitcoin Cash Price Analysis
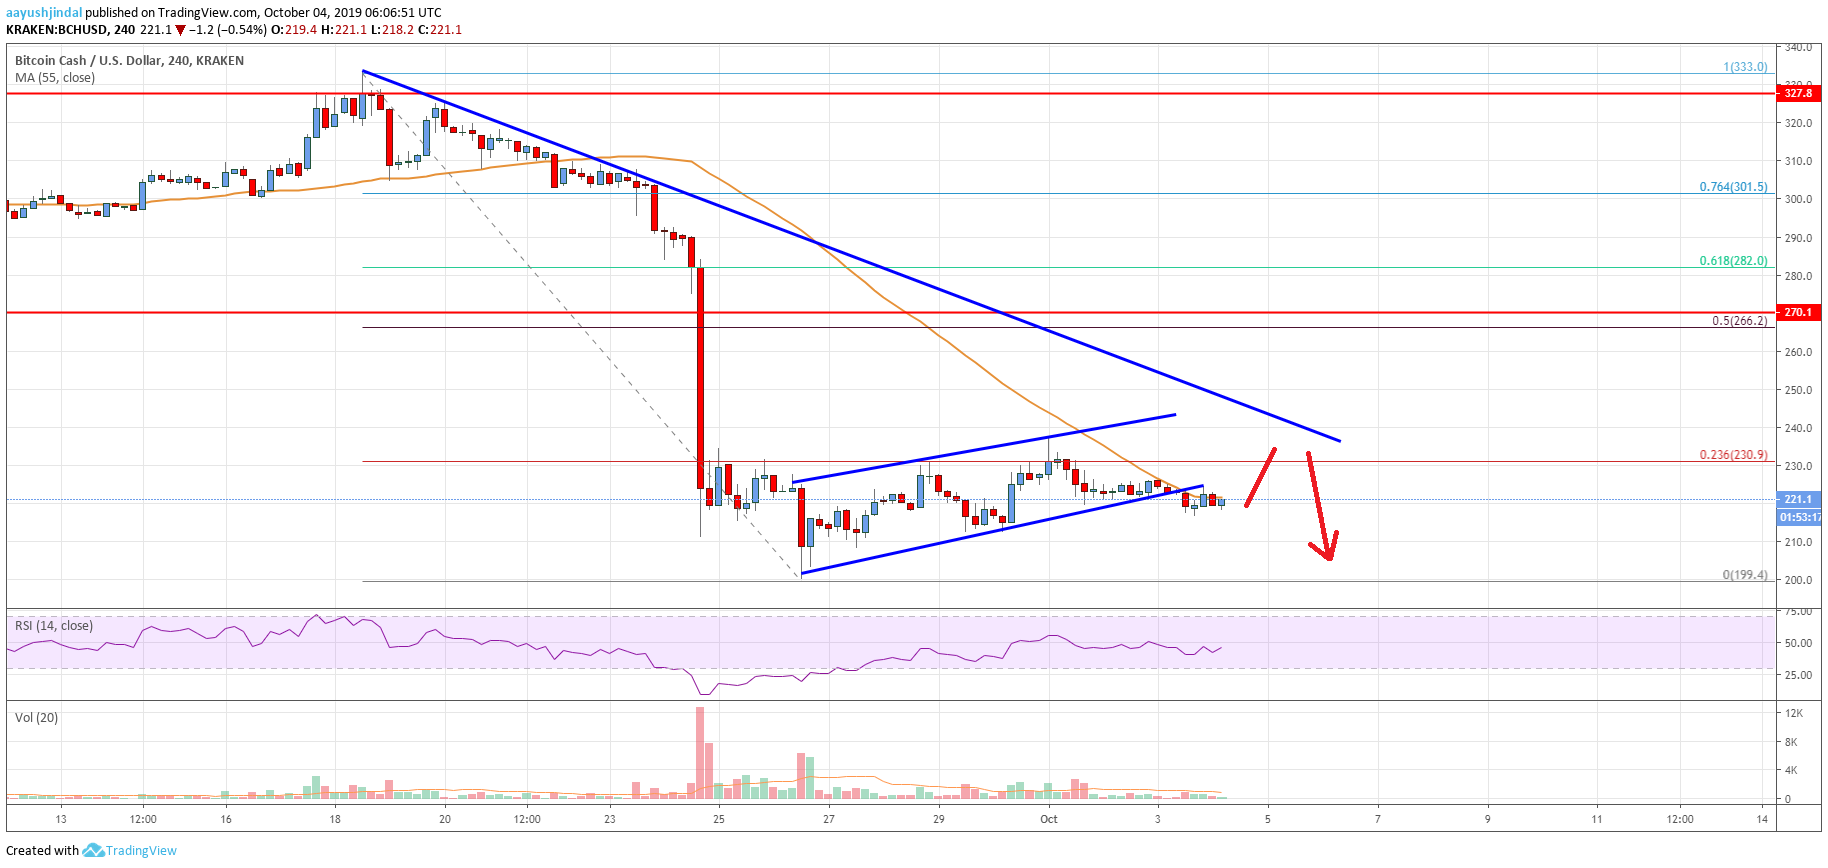
This past week, bitcoin cash price extended its decline below the $250 support against the US Dollar. The BCH/USD pair even broke the $230 and $220 support. Moreover, there was a close below the $250 level and the 55 simple moving average (4-hours). The price tested the $200 support area and recently started an upside correction. It broke the $220 and $225 levels.
Moreover, there was a break above the 23.6% Fib retracement level of the last major decline from the $333 high to $199 low. However, the price failed to gain momentum above the $230 resistance and the 55 simple moving average (4-hours). It resumed its decline and traded below an ascending channel with support near the $224 level on the 4-hours chart of the BCH/USD pair.
The price is currently consolidating near the $220 level. It seems like there could be another correction towards the $230 or $240 resistance area. More importantly, there is a key bearish trend line forming with resistance near $240 on the same chart. If there is an upside break above the trend line, the price could recover towards the $265 and $270 resistance levels.
The 50% Fib retracement level of the last major decline from the $333 high to $199 low is also near the $266 level to act as a resistance. Conversely, if the price fails to break $230 or $240, it could resume its decline. An immediate support is near the $210 level. However, the main support is near $200, below which the price could decline significantly.
Looking at the chart, bitcoin cash price is clearly struggling to recover above the $230 and $240 resistance levels. As long as the price is below the $250 pivot level, there are chances of more downsides in the near term.
Technical indicators
4 hours MACD - The MACD for BCH/USD is losing momentum in the bullish zone.
4 hours RSI (Relative Strength Index) - The RSI for BCH/USD is currently well below the 50 level.
Key Support Levels - $210 and $200.
Key Resistance Levels - $230 and $240.
The post Bitcoin Cash Analysis: BCH Facing Key Resistance Near $250 appeared first on Live Bitcoin News.

Cryptocurrency is a digital currency that uses encryption (cryptography) to regulate the generation of currency and verify the transfer of funds, independently of a central bank. Cryptography is the practice and study of techniques for secure communication in the presence of third party adversaries.
Blockchain 101 · Crytpo Currency Market
---------------------------------------------------
Trezor: Hardware Wallet
Binance: Exchange for Traders
Ledger Nano S: Hardware Wallet
Coinbase: Exchange for Investors
CoinSwitch: Wallet-to-Wallet Exchange