
- Litecoin price started a sharp decline after it broke the key $56.20 support against the US Dollar.
- LTC price is now trading well below the $55.00 and $53.75 support levels.
- There was a break below a crucial contracting triangle with support near $56.20 on the 4-hours chart of the LTC/USD pair (data feed from Coinbase).
- The pair remains at a risk of more downsides if it fails to stay above the $51.00 and $50.00 supports.
Litecoin price is declining and trading below $55.00 against the US Dollar, similar to bitcoin. LTC price could accelerate losses if it fails to hold the $50.00 support.
Litecoin Price Analysis
Earlier this week, litecoin price made an attempt to surpass the $58.00 resistance area against the US Dollar. However, the LTC/USD pair failed to gain strength above the $57.50 level and formed a swing high near $57.86. As a result, there was a fresh decline below the $56.50 and $55.00 support levels. Moreover, there was a close below the $55.00 level and the 55 simple moving average (4-hours).
During the decline, there was a break below a crucial contracting triangle with support near $56.20 on the 4-hours chart of the LTC/USD pair. The pair even broke the $53.75 support area and traded towards the $51.00 level. A low was formed recently near $51.16 and the price is currently consolidating losses. An immediate resistance is near the $52.80 level. Additionally, the 23.6% Fib retracement level of the recent decline from the $57.86 high to $51.16 low is also near the $52.74 level.
If there is an upside correction above $52.80, the price could test the $53.75 resistance area (the previous support). The next key resistance is near the $54.50 level. It represents the 50% Fib retracement level of the recent decline from the $57.86 high to $51.16 low. If there is an upside break above $54.50, litecoin could test the $56.20 resistance and the 55 simple moving average (4-hours).
On the downside, an immediate support is near the $51.00 level. If there is a downside break below the $51.00 support, the price might even struggle to hold the $50.00 support. The next major support is near the $48.00 and $47.50 levels.
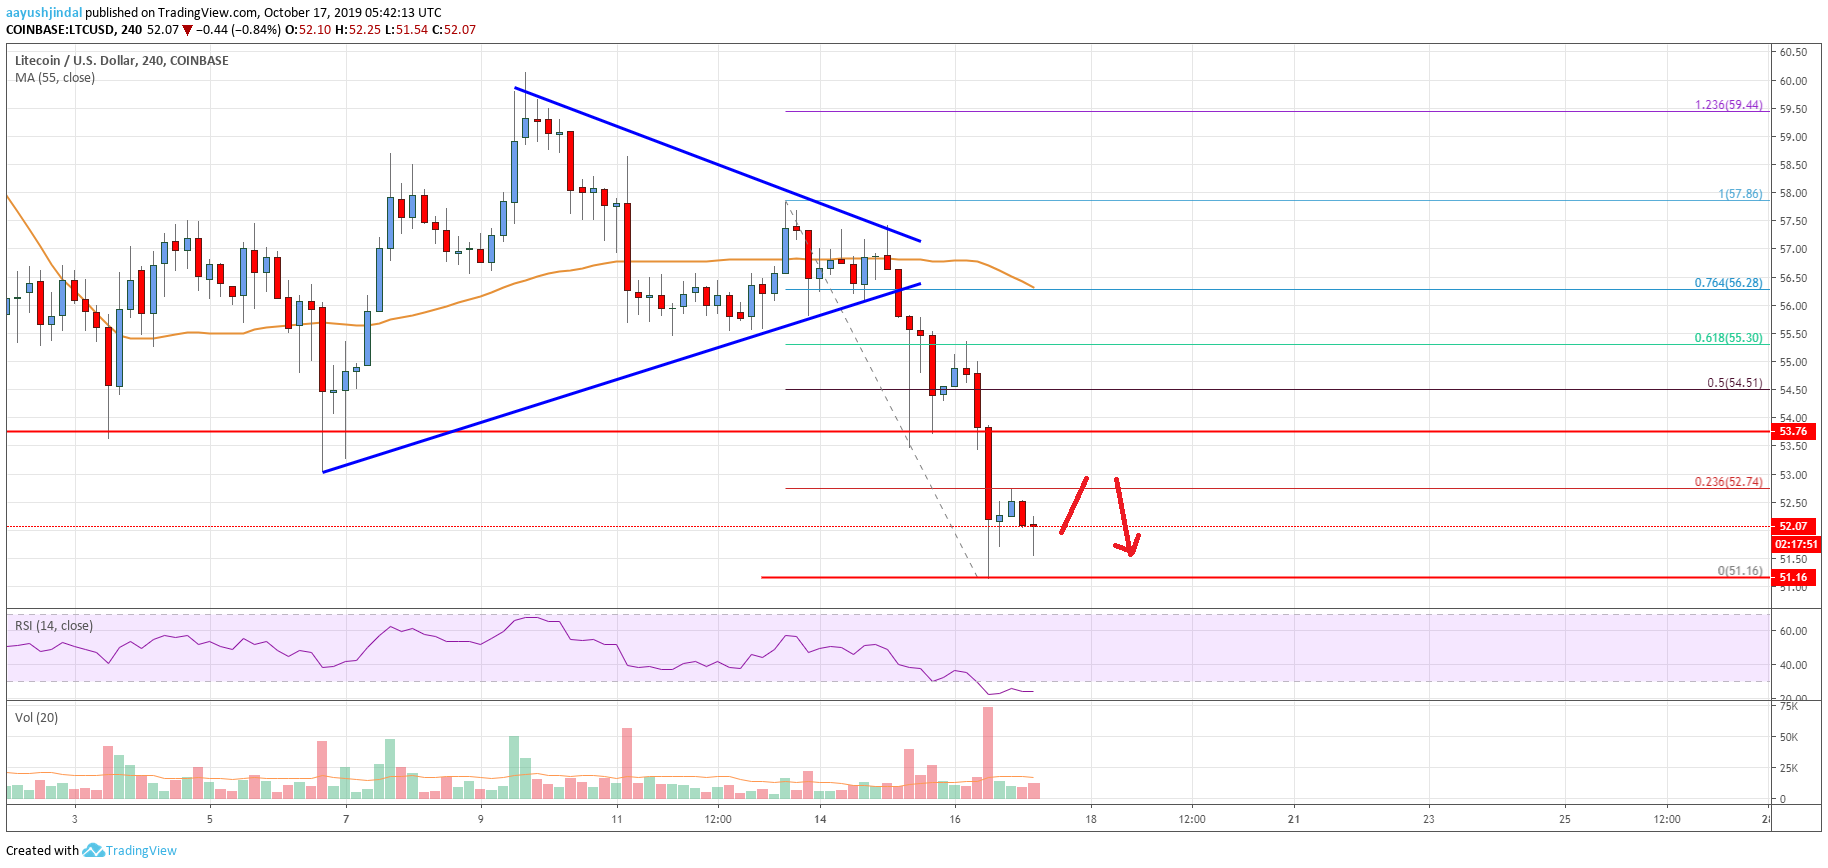
Looking at the chart, litecoin price is clearly trading in a bearish zone below the $53.75 and $54.50 levels. As long as there is close above $56.20, there are chances of more downsides below $51.00.
Technical indicators
4 hours MACD - The MACD for LTC/USD is showing negative signs in the bearish zone.
4 hours RSI (Relative Strength Index) - The RSI for LTC/USD is now well below the 30 level.
Key Support Levels - $51.00 and $50.00.
Key Resistance Levels - $53.75 and $54.50.
The post Litecoin (LTC) Price Analysis: Bears Eye Losses Below $50 appeared first on Live Bitcoin News.

Cryptocurrency is a digital currency that uses encryption (cryptography) to regulate the generation of currency and verify the transfer of funds, independently of a central bank. Cryptography is the practice and study of techniques for secure communication in the presence of third party adversaries.
Blockchain 101 · Crytpo Currency Market
---------------------------------------------------
Trezor: Hardware Wallet
Binance: Exchange for Traders
Ledger Nano S: Hardware Wallet
Coinbase: Exchange for Investors
CoinSwitch: Wallet-to-Wallet Exchange