
- Litecoin price is currently correcting lower below the $60.50 resistance against the US Dollar.
- LTC price is currently holding the key $57.10 and $55.80 support levels, with a positive bias.
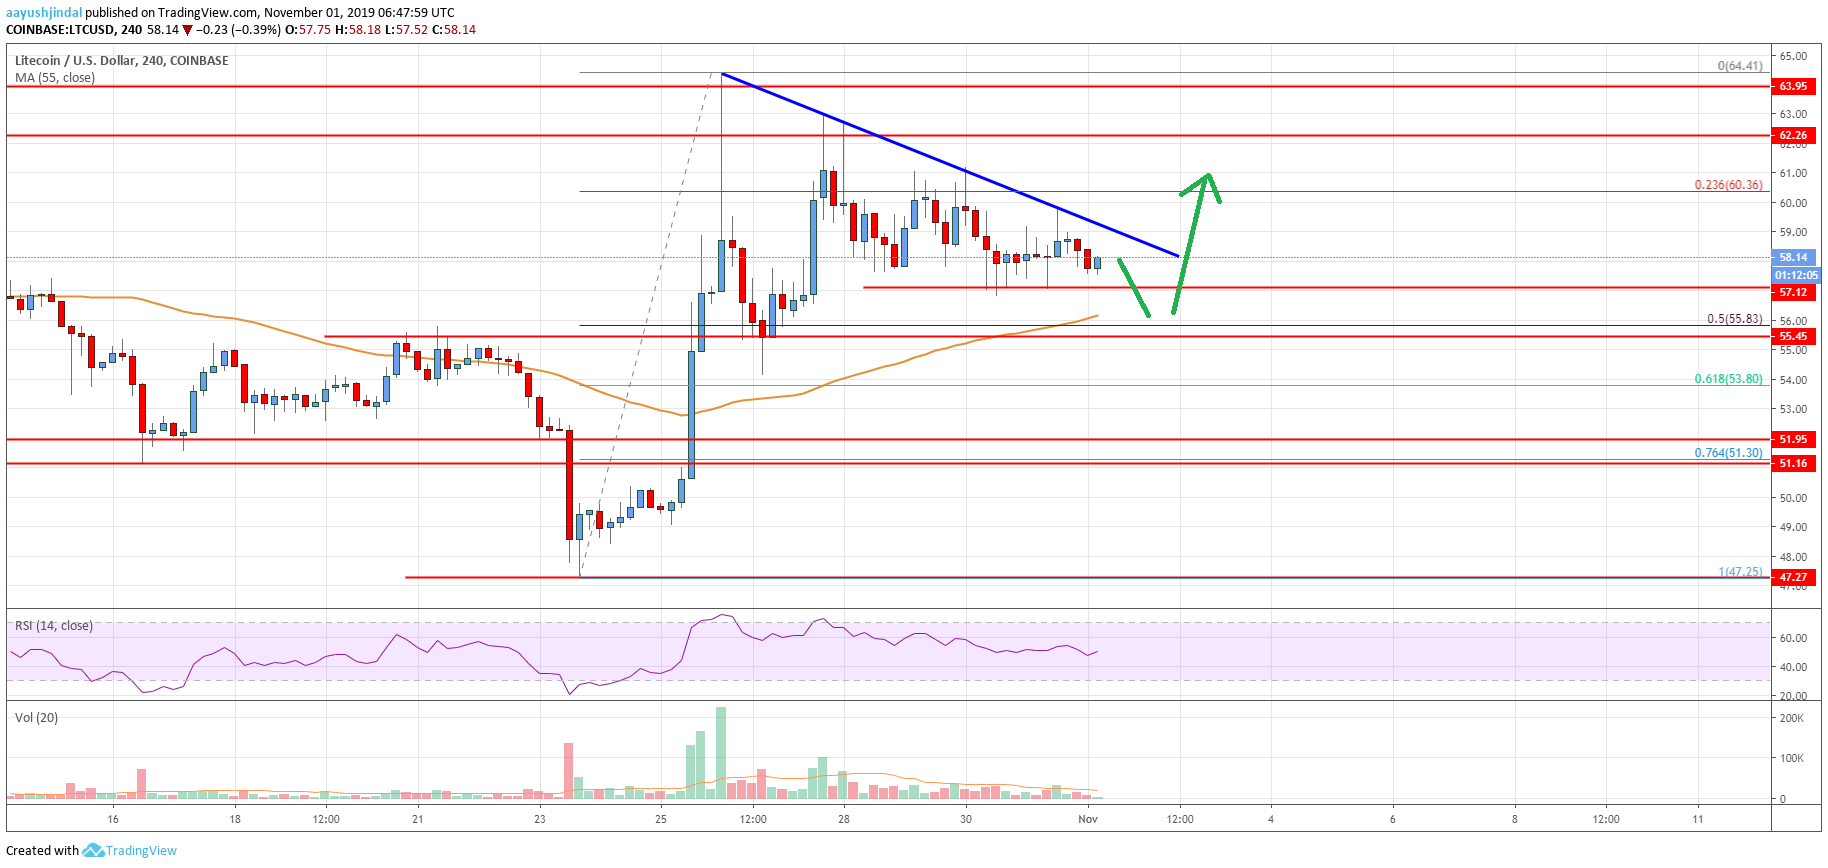
- There is a major bearish trend line forming with resistance near $58.90 on the 4-hours chart of the LTC/USD pair (data feed from Coinbase).
- The pair could dip once last time towards the $55.80 support area before it started a decent upward move.
Litecoin price is retreating from the recent high near $64.40 against the US Dollar, similar to bitcoin. LTC price could decline further, but it remains supported near $55.80.
Litecoin Price Analysis
Recently, there was a sharp rally in bitcoin, Ethereum ripple and litecoin against the US Dollar. LTC price broke many hurdles during the rise such as $54.00 and $55.80 resistance levels.
Moreover, there was an upside break above the $60.00 resistance and the 55 simple moving average (4-hours). Later, there was a downside correction and the price traded below the $60.00 pivot level.
Litecoin corrected below the 23.6% Fib retracement level of the upward move from the $47.25 low to $64.41 high. However, the price remained well bid above the $55.80 and $55.50 support levels. More importantly, the price found support near the 55 simple moving average (4-hours).
At the outset, the price is trading above the 50% Fib retracement level of the upward move from the $47.25 low to $64.41 high. If there is another bearish reaction, the $55.80 level and the 55 SMA are likely to provide support.
Having said that, if the price fails to stay above $55.80, there could be an extended decline towards the $52.00 support area. On the upside, there are a few important resistances forming near the $59.00 and $60.00 levels.
There is also a major bearish trend line forming with resistance near $58.90 on the 4-hours chart of the LTC/USD pair. If there is a successful break and close above $60.00, the price might start a fresh increase above $62.00 in the near term. The next major resistances on the upside are near $64.50 and $65.00.
Looking at the chart, litecoin price is currently correcting lower below $60.00. It seems like there could be another decline towards the $58.50 and $58.00 support levels before the price rebounds and climbs again. On the upside, the bulls need to gain pace above the $60.00 resistance to set the stage for more upsides.
Technical indicators
4 hours MACD - The MACD for LTC/USD is gaining pace in the bearish zone.
4 hours RSI (Relative Strength Index) - The RSI for LTC/USD is currently near 50, with a bullish angle.
Key Support Levels - $58.50 and $52.00.
Key Resistance Levels - $60.00 and $64.50.
The post Litecoin (LTC) Price Analysis: Last Dip Before Fresh Increase? appeared first on Live Bitcoin News.

Cryptocurrency is a digital currency that uses encryption (cryptography) to regulate the generation of currency and verify the transfer of funds, independently of a central bank. Cryptography is the practice and study of techniques for secure communication in the presence of third party adversaries.
Blockchain 101 · Crytpo Currency Market
---------------------------------------------------
Trezor: Hardware Wallet
Binance: Exchange for Traders
Ledger Nano S: Hardware Wallet
Coinbase: Exchange for Investors
CoinSwitch: Wallet-to-Wallet Exchange