
- Bitcoin cash price is trading in a bearish zone below the $210 and $216 resistances against the US Dollar.
- The price is struggling to stay above the key $203 and $200 support levels.
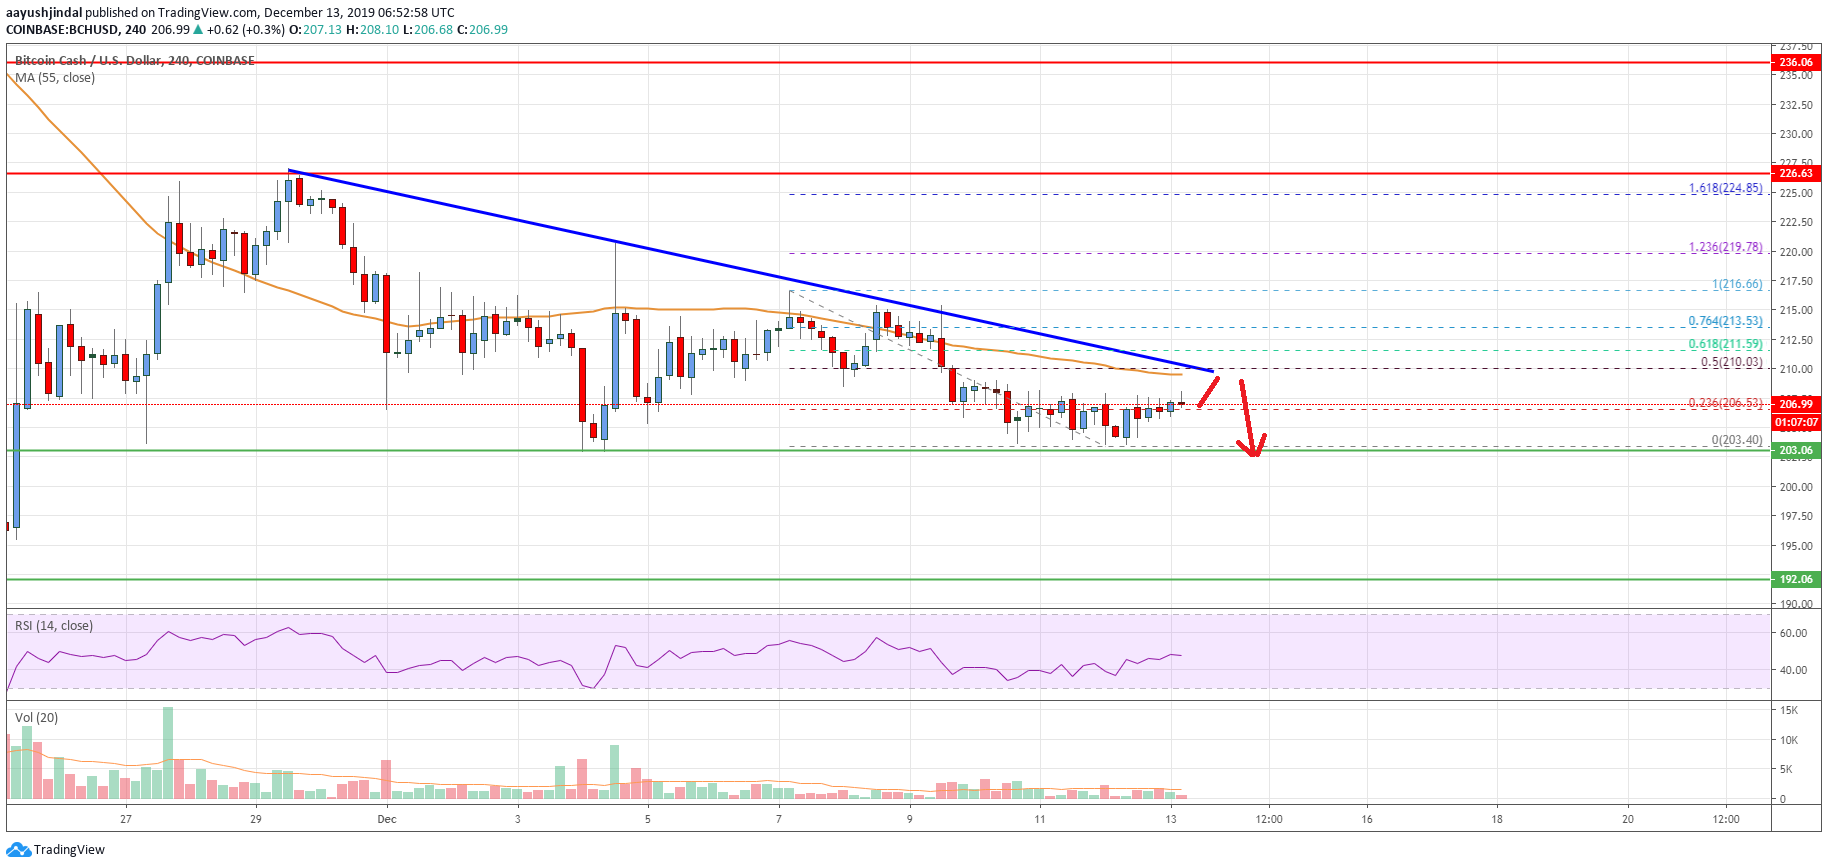
- There is a major bearish trend line forming with resistance near $210 on the 4-hours chart of the BCH/USD pair (data feed from Coinbase).
- The pair could resume its decline if it breaks the $203 support area in the near term.
Bitcoin cash price is following a bearish path below $210 against the US Dollar. BCH/USD must recover above $210 and $216 to avoid a nasty decline below the $200 support.
Bitcoin Cash Price Analysis
In the past few days, bitcoin cash price remained in a bearish zone below the $220 and $226 resistances against the US Dollar. Moreover, BCH price settled below the $216 pivot level and 55 simple moving average (4-hours).
As a result, the price traded below the $210 support and tested the $203-$204 support area. It is currently consolidating losses above the $204 level and testing the 23.6% Fib retracement level of the recent decline from the $216 high to $203 low.
On the upside, there is a major hurdle forming near $210 and 55 simple moving average (4-hours). Besides, there is a major bearish trend line forming with resistance near $210 on the 4-hours chart of the BCH/USD pair.
The 50% Fib retracement level of the recent decline from the $216 high to $203 low is also near the $210 level. Therefore, an upside break above the $210 and $211 resistance levels is must for a decent recovery.
The next major resistance is near the $216 level. An intermediate resistance is near the 76.4% Fib retracement level of the recent decline from the $216 high to $203 low.
If the price manages to surpass the $210 and $216 resistance levels, there are chances a strong recovery towards the $226 and $236 resistance levels in the near term.
Conversely, the price could struggle to rise above $210 and $216. In the mentioned case, the price is likely to break the $203 and $200 support levels.
Bitcoin Cash Price
Looking at the chart, bitcoin cash price is clearly trading in a bearish zone below the $210 level. The price action suggests that there is a high risk of a downside break below the $203 and $200 support levels.
Technical indicators
4 hours MACD - The MACD for BCH/USD is slowly losing momentum in the bearish zone.
4 hours RSI (Relative Strength Index) - The RSI for BCH/USD is currently just below the 50 level.
Key Support Levels - $200 and $192.
Key Resistance Levels - $210 and $216.
The post Bitcoin Cash Analysis: BCH Could Resume Its Decline appeared first on Live Bitcoin News.