
- Stellar lumen price is struggling to climb above the $0.0565 and $0.0580 resistances against the US Dollar.
- XLM price is currently trading in a range above the main $0.0535 support area.
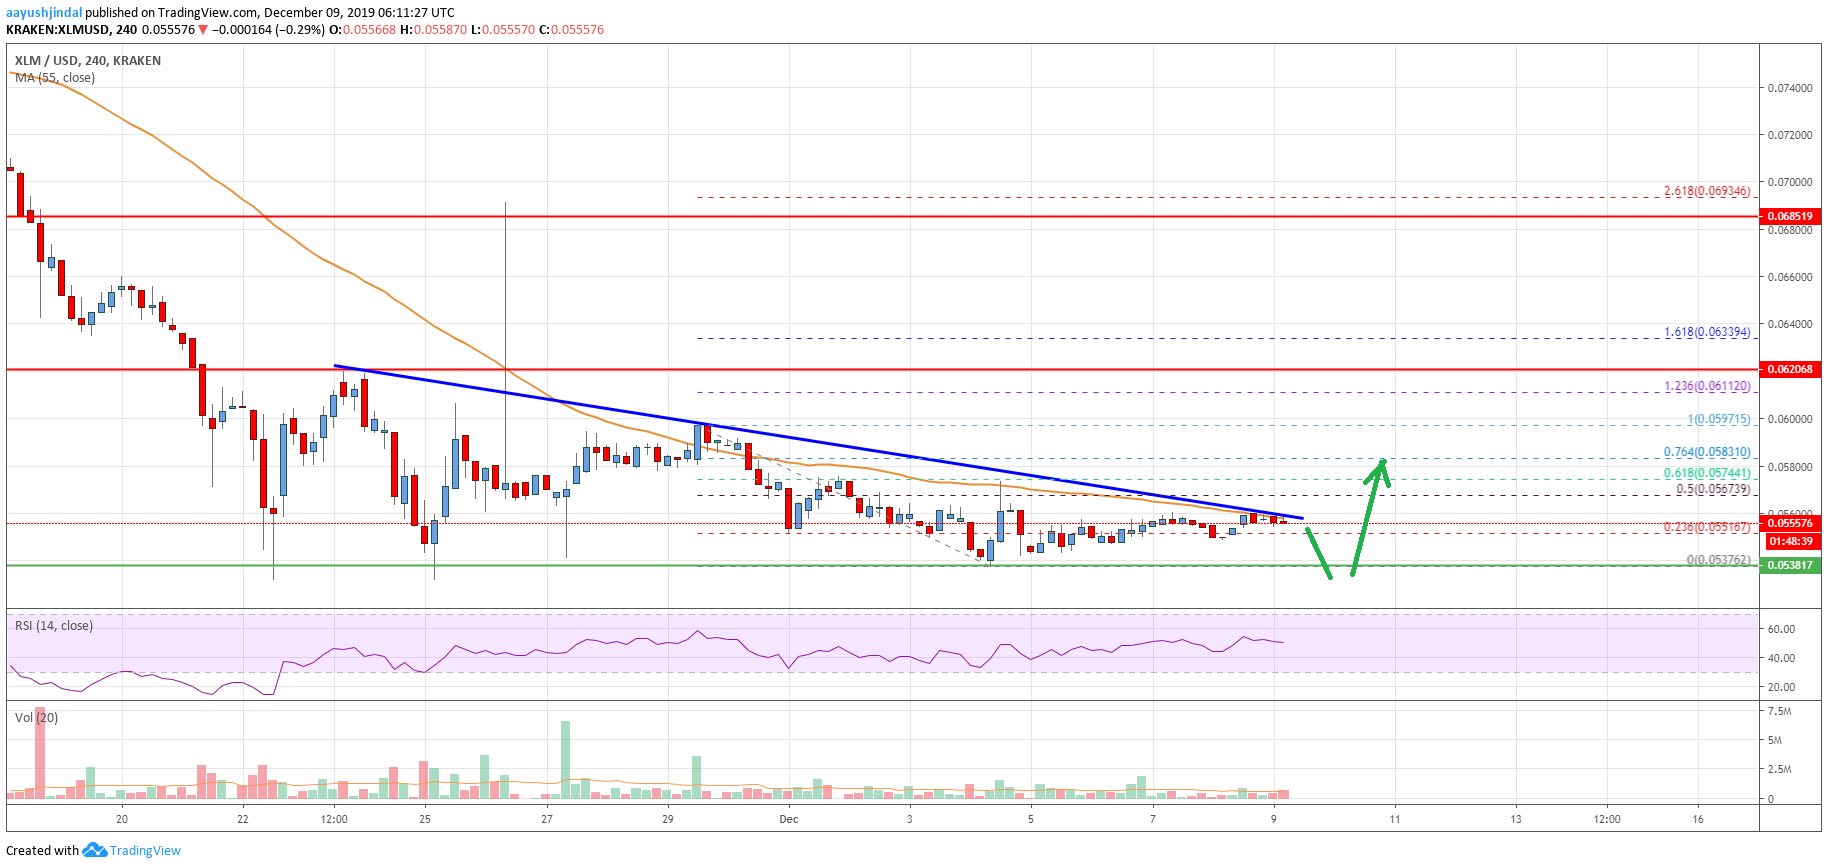
- There is a major bearish trend line forming with resistance near $0.0562 on the 4-hours chart (data feed via Kraken).
- The pair could dive towards $0.0520 before it starts a fresh increase towards $0.0620 and $0.0650.
Stellar lumen price is showing bearish signs against the US Dollar and bitcoin. XLM price must surpass the $0.0620 resistance to move into a positive zone.
Stellar Lumen Price Analysis (XLM to USD)
In the past few days, stellar lumen price remained in a bearish zone below the $0.0620 pivot level against the US Dollar. As a result, the XLM/USD pair traded below the $0.0600 and $0.0580 support levels.
Moreover, the price settled below the $0.0580 level and the 55 simple moving average (4-hours). Finally, the price declined below the $0.0550 level and tested the main $0.0535 support area.
The recent low was near $0.0537 and the price is currently correcting higher. It is trading above the 23.6% Fibonacci retracement level of the recent decline from the $0.0597 high to $0.0537 low.
However, the price seems to be facing resistance near the $0.0560 level and the 55 simple moving average (4-hours). Besides, there is a major bearish trend line forming with resistance near $0.0562 on the 4-hours chart.
Above the trend line, the next resistance is near $0.0567. Additionally, the 50% Fibonacci retracement level of the recent decline from the $0.0597 high to $0.0537 low is at $0.0567.
A clear break above $0.0567 and a follow through above the $0.0580 resistance could push the price towards the main $0.0620 resistance area. Any further gains may perhaps lead stellar price towards the $0.0685 level.
An intermediate resistance is near the $0.0633 level since it is the 1.618 Fib extension level of the recent decline from the $0.0597 high to $0.0537 low.
On the downside, the main support is near the $0.0635 level. If there is a downside break below $0.0635, the price might test $0.0620 or even $0.0600 in the near term.
The chart indicates that XLM price is clearly trading in a bearish zone below $0.0565 and $0.0580. The current price action suggests the price could dive below the $0.0635 support area before it starts a fresh increase.
Technical Indicators
4 hours MACD - The MACD for XLM/USD is currently showing a few bearish signs.
4 hours RSI - The RSI for XLM/USD is currently declining and it is just below the 50 level.
Key Support Levels - $0.0535 and $0.0520.
Key Resistance Levels - $0.0565, $0.0580 and $0.0620.
The post Stellar Lumen (XLM) Price Could Dive Before Fresh Increase appeared first on Live Bitcoin News.