
- Litecoin price declined heavily and broke the $62.00 support area against the US Dollar.
- LTC price is traded towards the $50.00 support area and it is currently consolidating losses.
- There was a break below a major bullish trend line with support near $71.40 on the 4-hours chart of the LTC/USD pair (data feed from Coinbase).
- The pair could correct higher, but it is likely to face resistance near $60.00 or $62.80.
Litecoin price is trading in a bearish zone against the US Dollar and bitcoin. LTC price remains at a risk of more downsides below the $52.00 and $50.00 levels.
Litecoin Price Analysis
This week, there was a nasty decline in litecoin price from the $75.00 resistance against the US Dollar. The LTC/USD pair broke many key supports near the $72.50 and $70.00 levels to move into a downtrend. More importantly, there was a close below the main $70.00 support area and the 55 simple moving average (4-hours). It opened the doors for more downsides below $65.00.
Moreover, there was a break below a major bullish trend line with support near $71.40 on the 4-hours chart of the LTC/USD pair. As a result, there was a sharp drop below the $64.00 and $62.80 support levels. Finally, the price traded close to the $50.00 support and formed a low at $53.10. At the moment, the price is consolidating losses above the $53.00 level.
An immediate resistance is near the $58.00 level. However, the first key resistance is near the $60.00 level. It coincides with the 23.6% Fib retracement level of the recent significant decline from the $80.32 high to $53.10 low. If there is an upside break above the $60.00 level, the price could recover towards the next key resistance at $62.80 and $63.95. The stated resistance near $63.00 acted as a support earlier and now it could prevent gains.
Conversely, the price could resume its decline if it fails to climb above $60.00. An immediate support is near the $52.50 level. The main support is near the $50.00 level, below which there is a risk of a breakdown towards the $40.00 support in the near term.
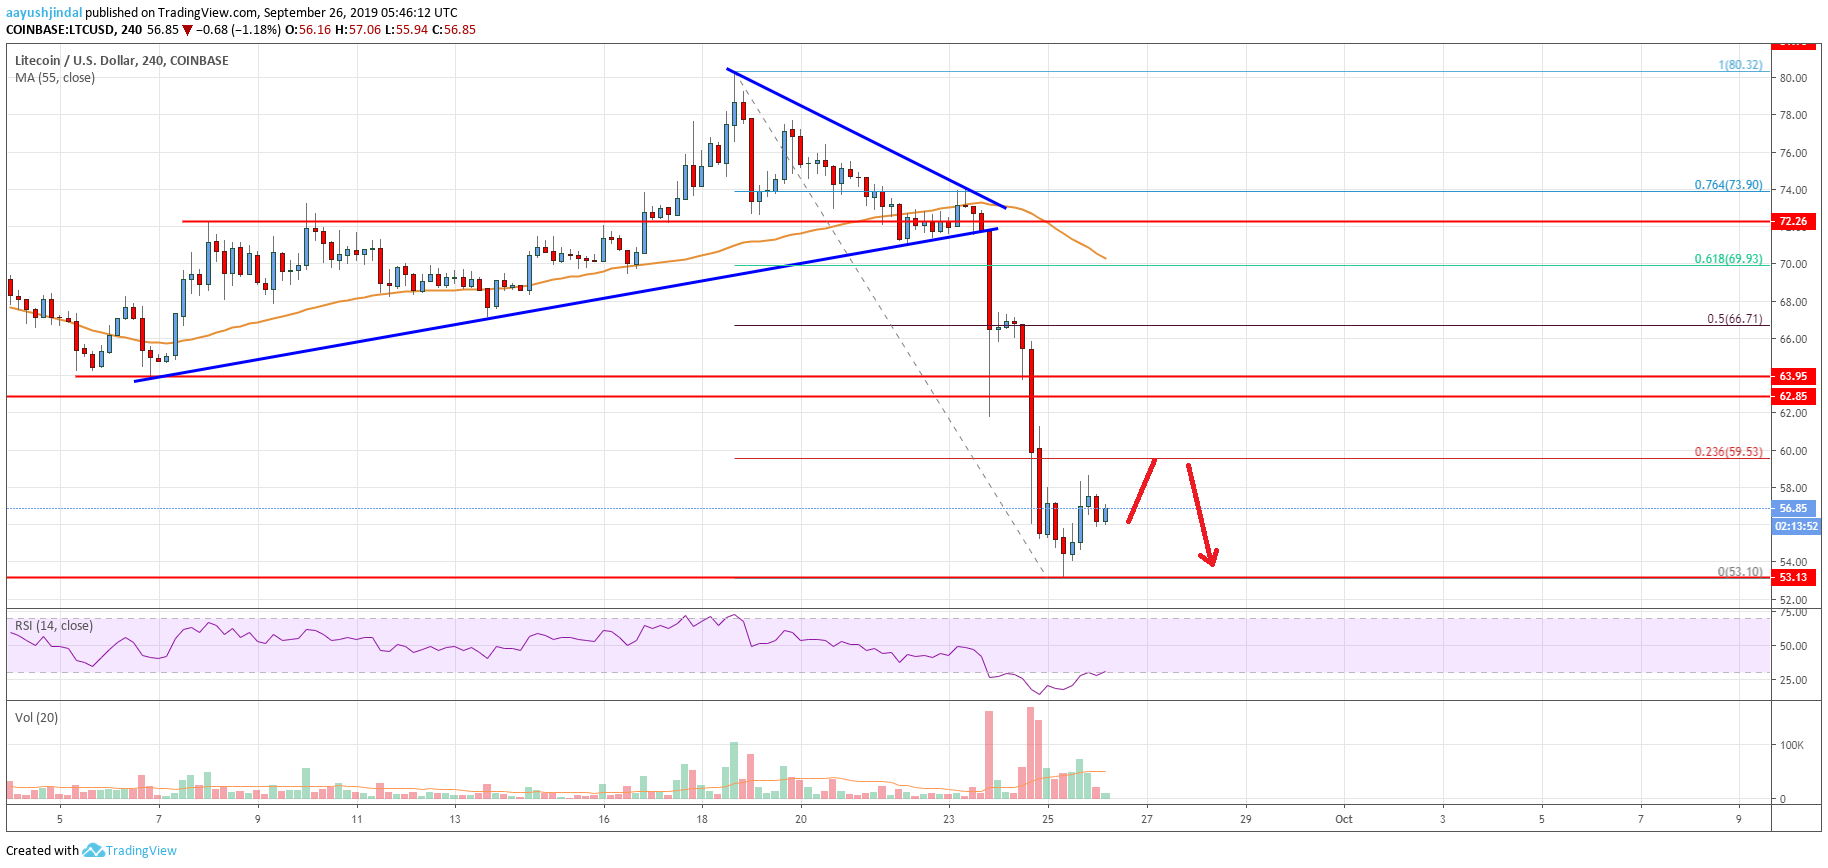
Looking at the chart, litecoin price is clearly trading in a bearish zone below the $62.80 and $60.00 support levels. As long as the price is below $65.00, there is a risk of more downsides. Having said that, it won’t be easy for the bears to push the price below the $50.00 support.
Technical indicators
4 hours MACD - The MACD for LTC/USD is slowly reducing its bearish slope.
4 hours RSI (Relative Strength Index) - The RSI for LTC/USD is currently correcting higher towards the 40 level.
Key Support Levels - $52.20 and $50.00.
Key Resistance Levels - $60.00 and $62.80.
The post Litecoin (LTC) Price Analysis: Recovery Likely To Fail Near $60-$62 appeared first on Live Bitcoin News.

Cryptocurrency is a digital currency that uses encryption (cryptography) to regulate the generation of currency and verify the transfer of funds, independently of a central bank. Cryptography is the practice and study of techniques for secure communication in the presence of third party adversaries.
Blockchain 101 · Crytpo Currency Market
---------------------------------------------------
Trezor: Hardware Wallet
Binance: Exchange for Traders
Ledger Nano S: Hardware Wallet
Coinbase: Exchange for Investors
CoinSwitch: Wallet-to-Wallet Exchange